
bitcoin death-cross study

TL;DR - decline into the death cross is expected and is mostly played out. Historically, post death cross we get a pretty violent bounce which is confluent with bitcoin price action post 25% decline (which we also saw recently).
—
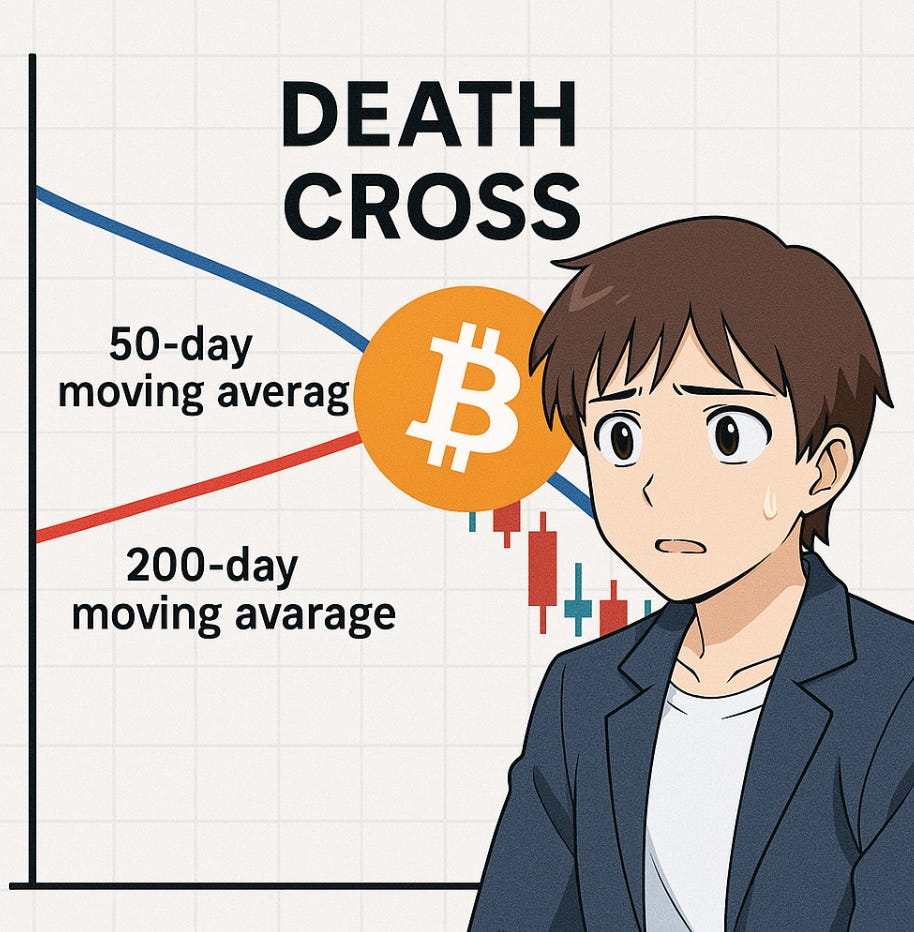
A death cross occurs when the 50d moving average intersects withe the 200d moving average. This is a significant technical analysis signal and indicates a bearish trend has begun.
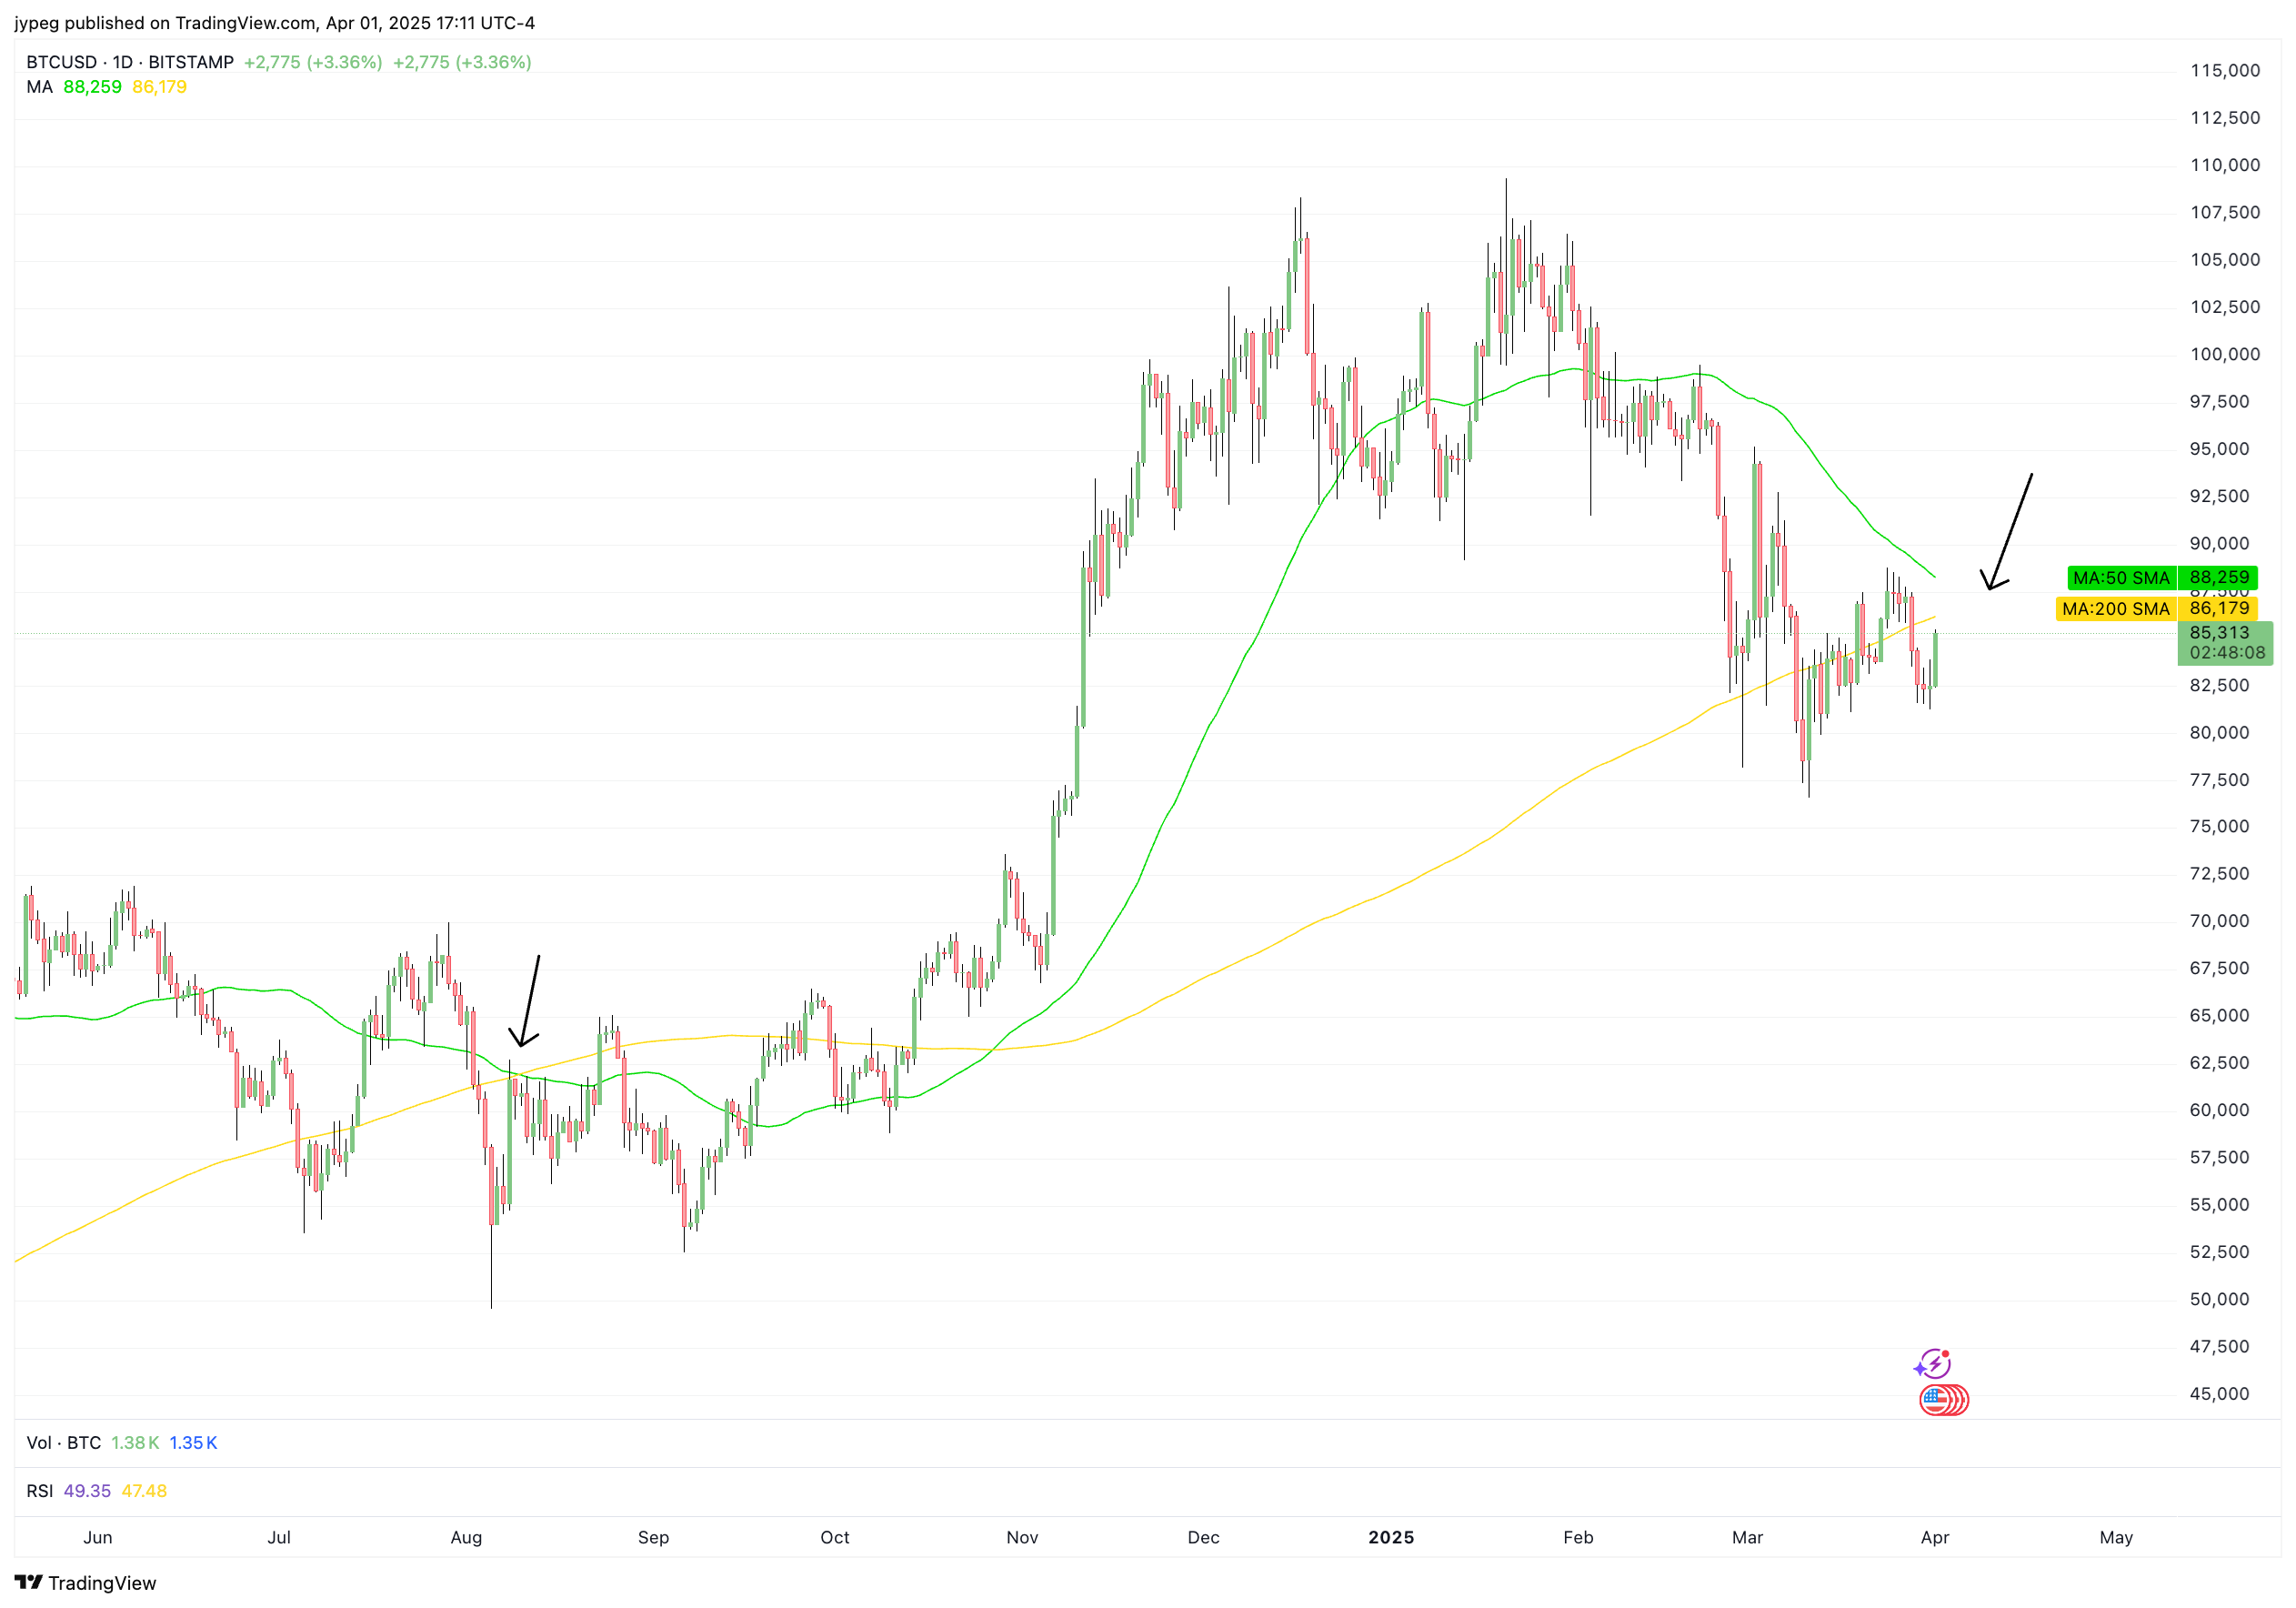
If we look at the bitcoin chart, its pretty clear that we are going to see a death-cross in the occur next week or so. If we estimate, the death cross should occur at 87k (where the moving averages intersect).
In the history of bitcoin’s price action, there have been 10 different death crosses from 2013 onwards. This will be a short analysis on how bitcoin price action performed pre/post death cross. Hopefully we can use this as a basis for making some profitable decisions.
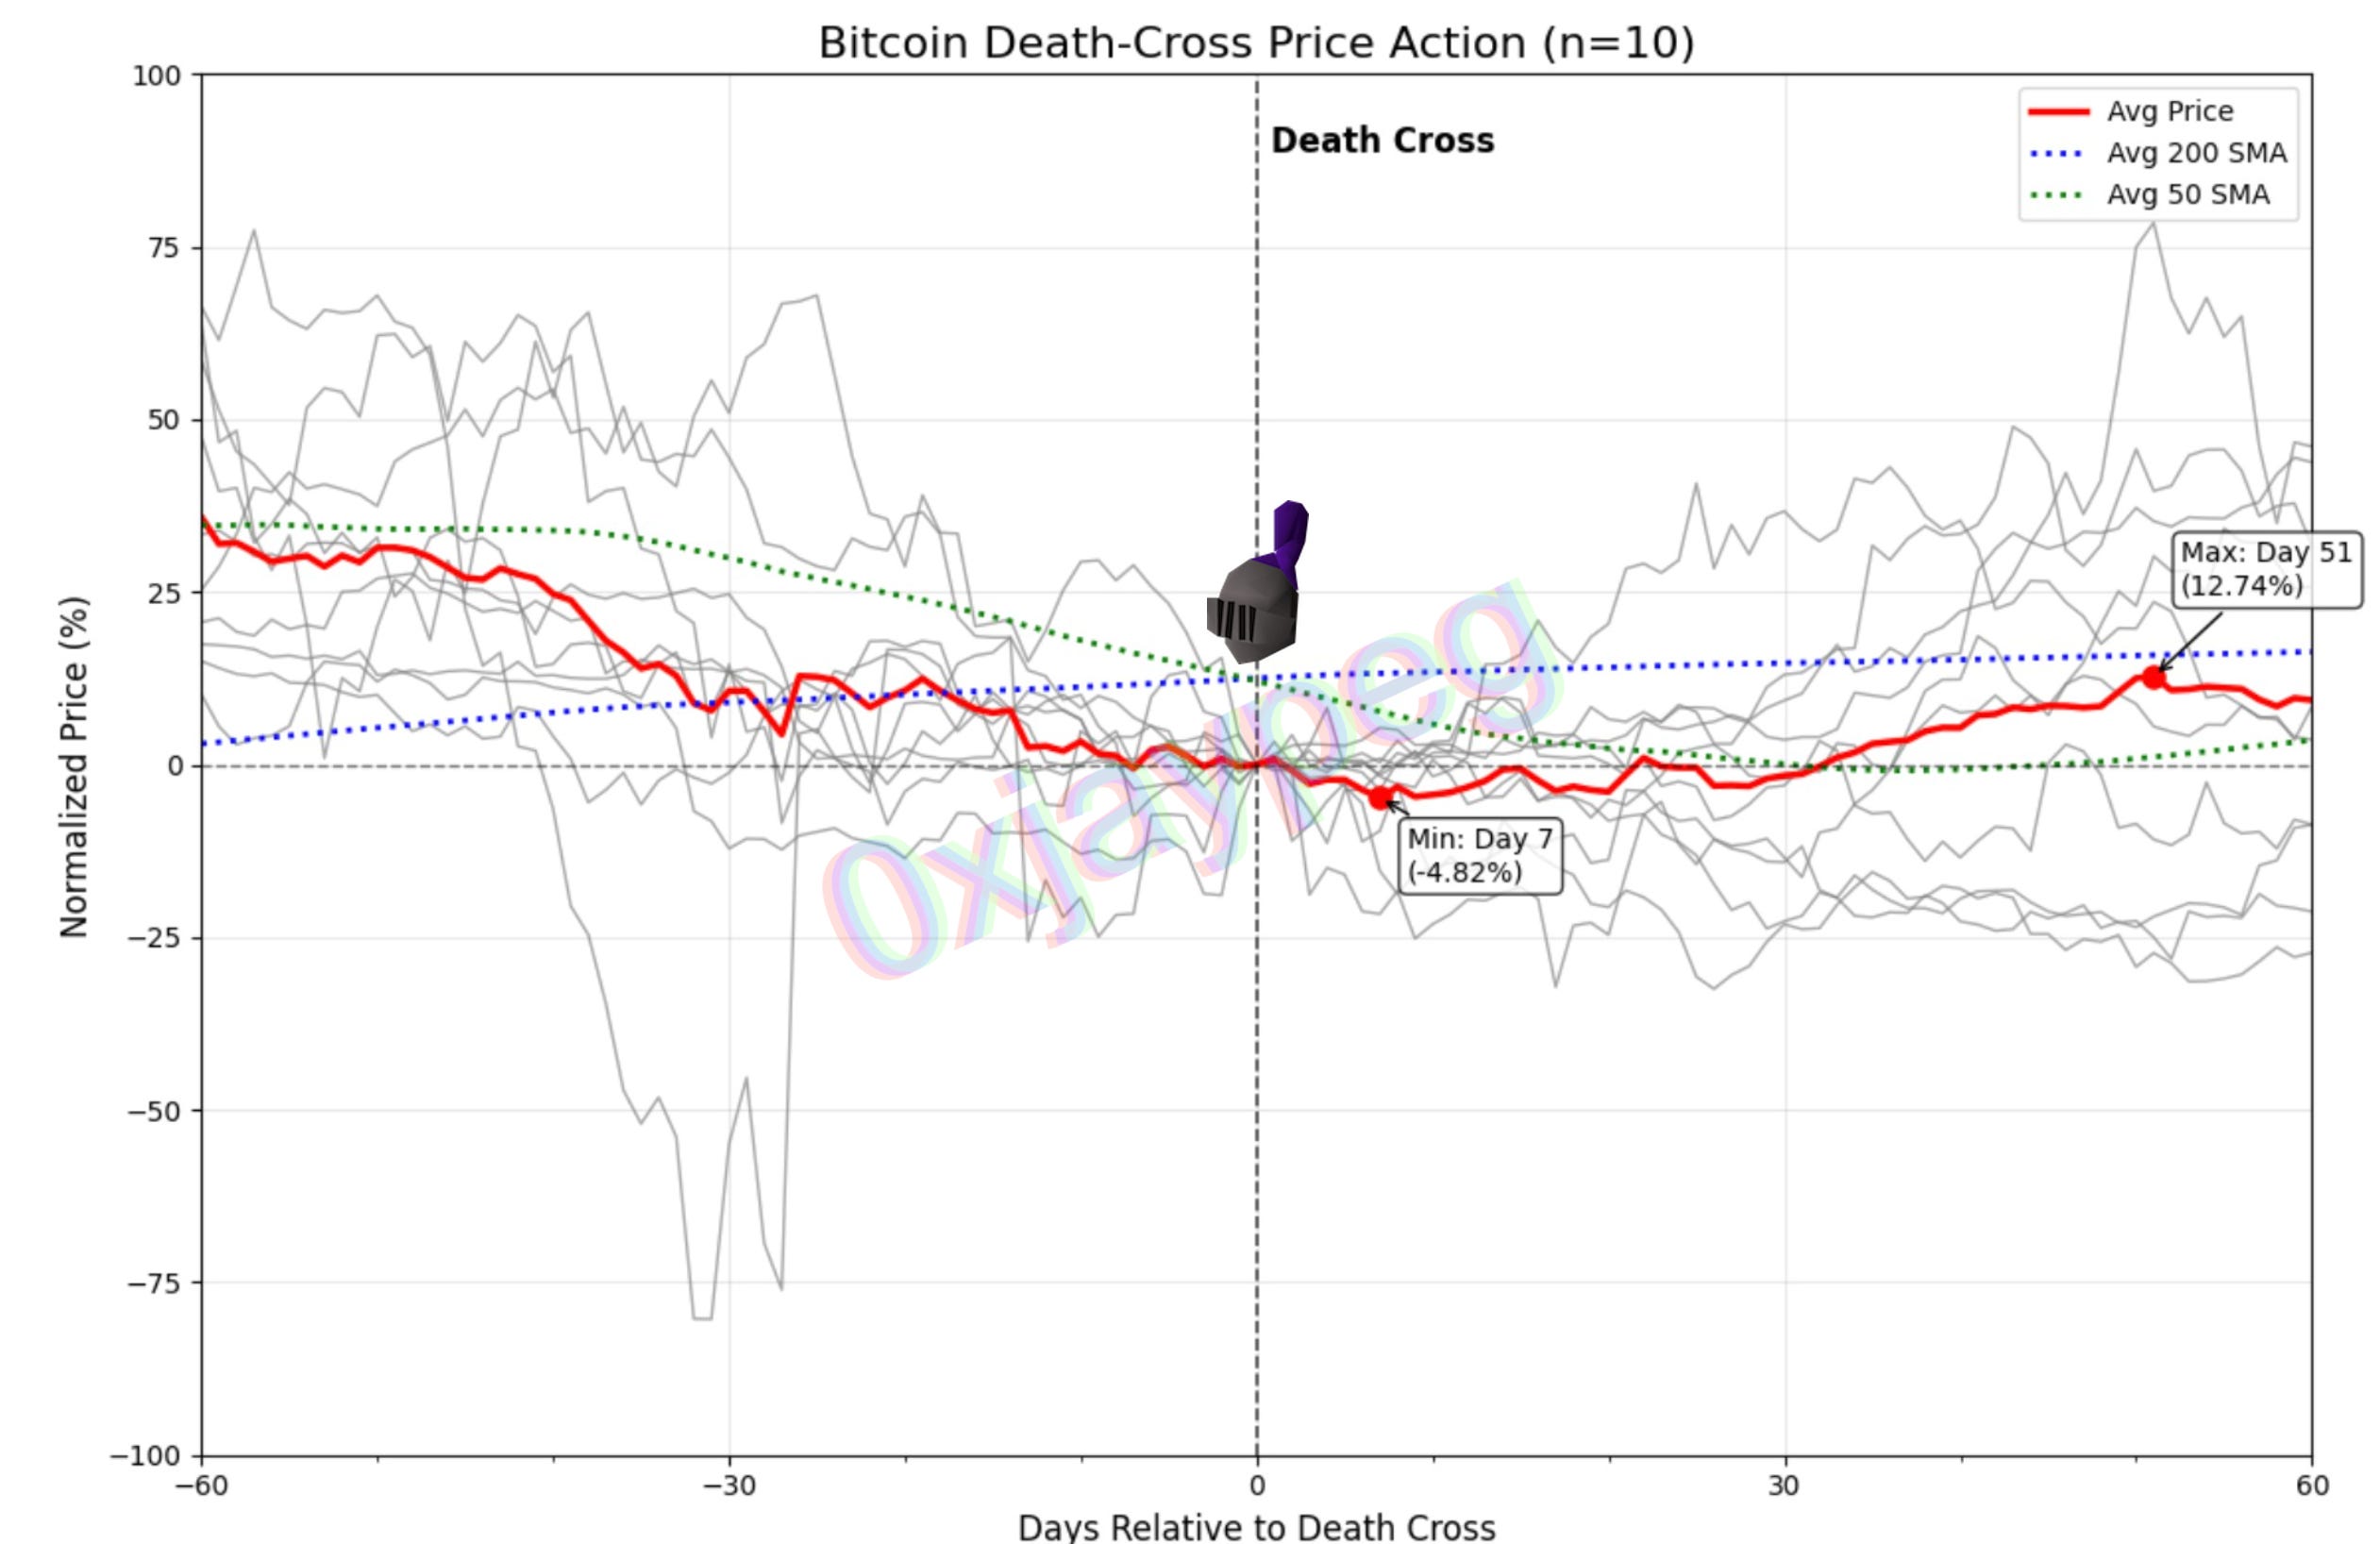
You can see that as we approach the death cross, there is a grind down in bitcoin price - we’ve seen the same thing in this instance. Bitcoin drew down from > 100k+ to the low 80k area.
What’s more interesting is how it performs after. From the chart and on average:
bitcoin tends to bottom about 7 days after at -4.82% from the death cross closing price
it makes a double bottom / higher low, and eventually goes up in a straight line starting around day 30
it peaks at +12.74% on day 51 (within the +- 60 day time frame)
What’s also interesting is the relationship between the moving averages. We can we see that around day 30, bitcoin reclaims the 200 day moving average, and it peaks right below the 50 day moving average as well.
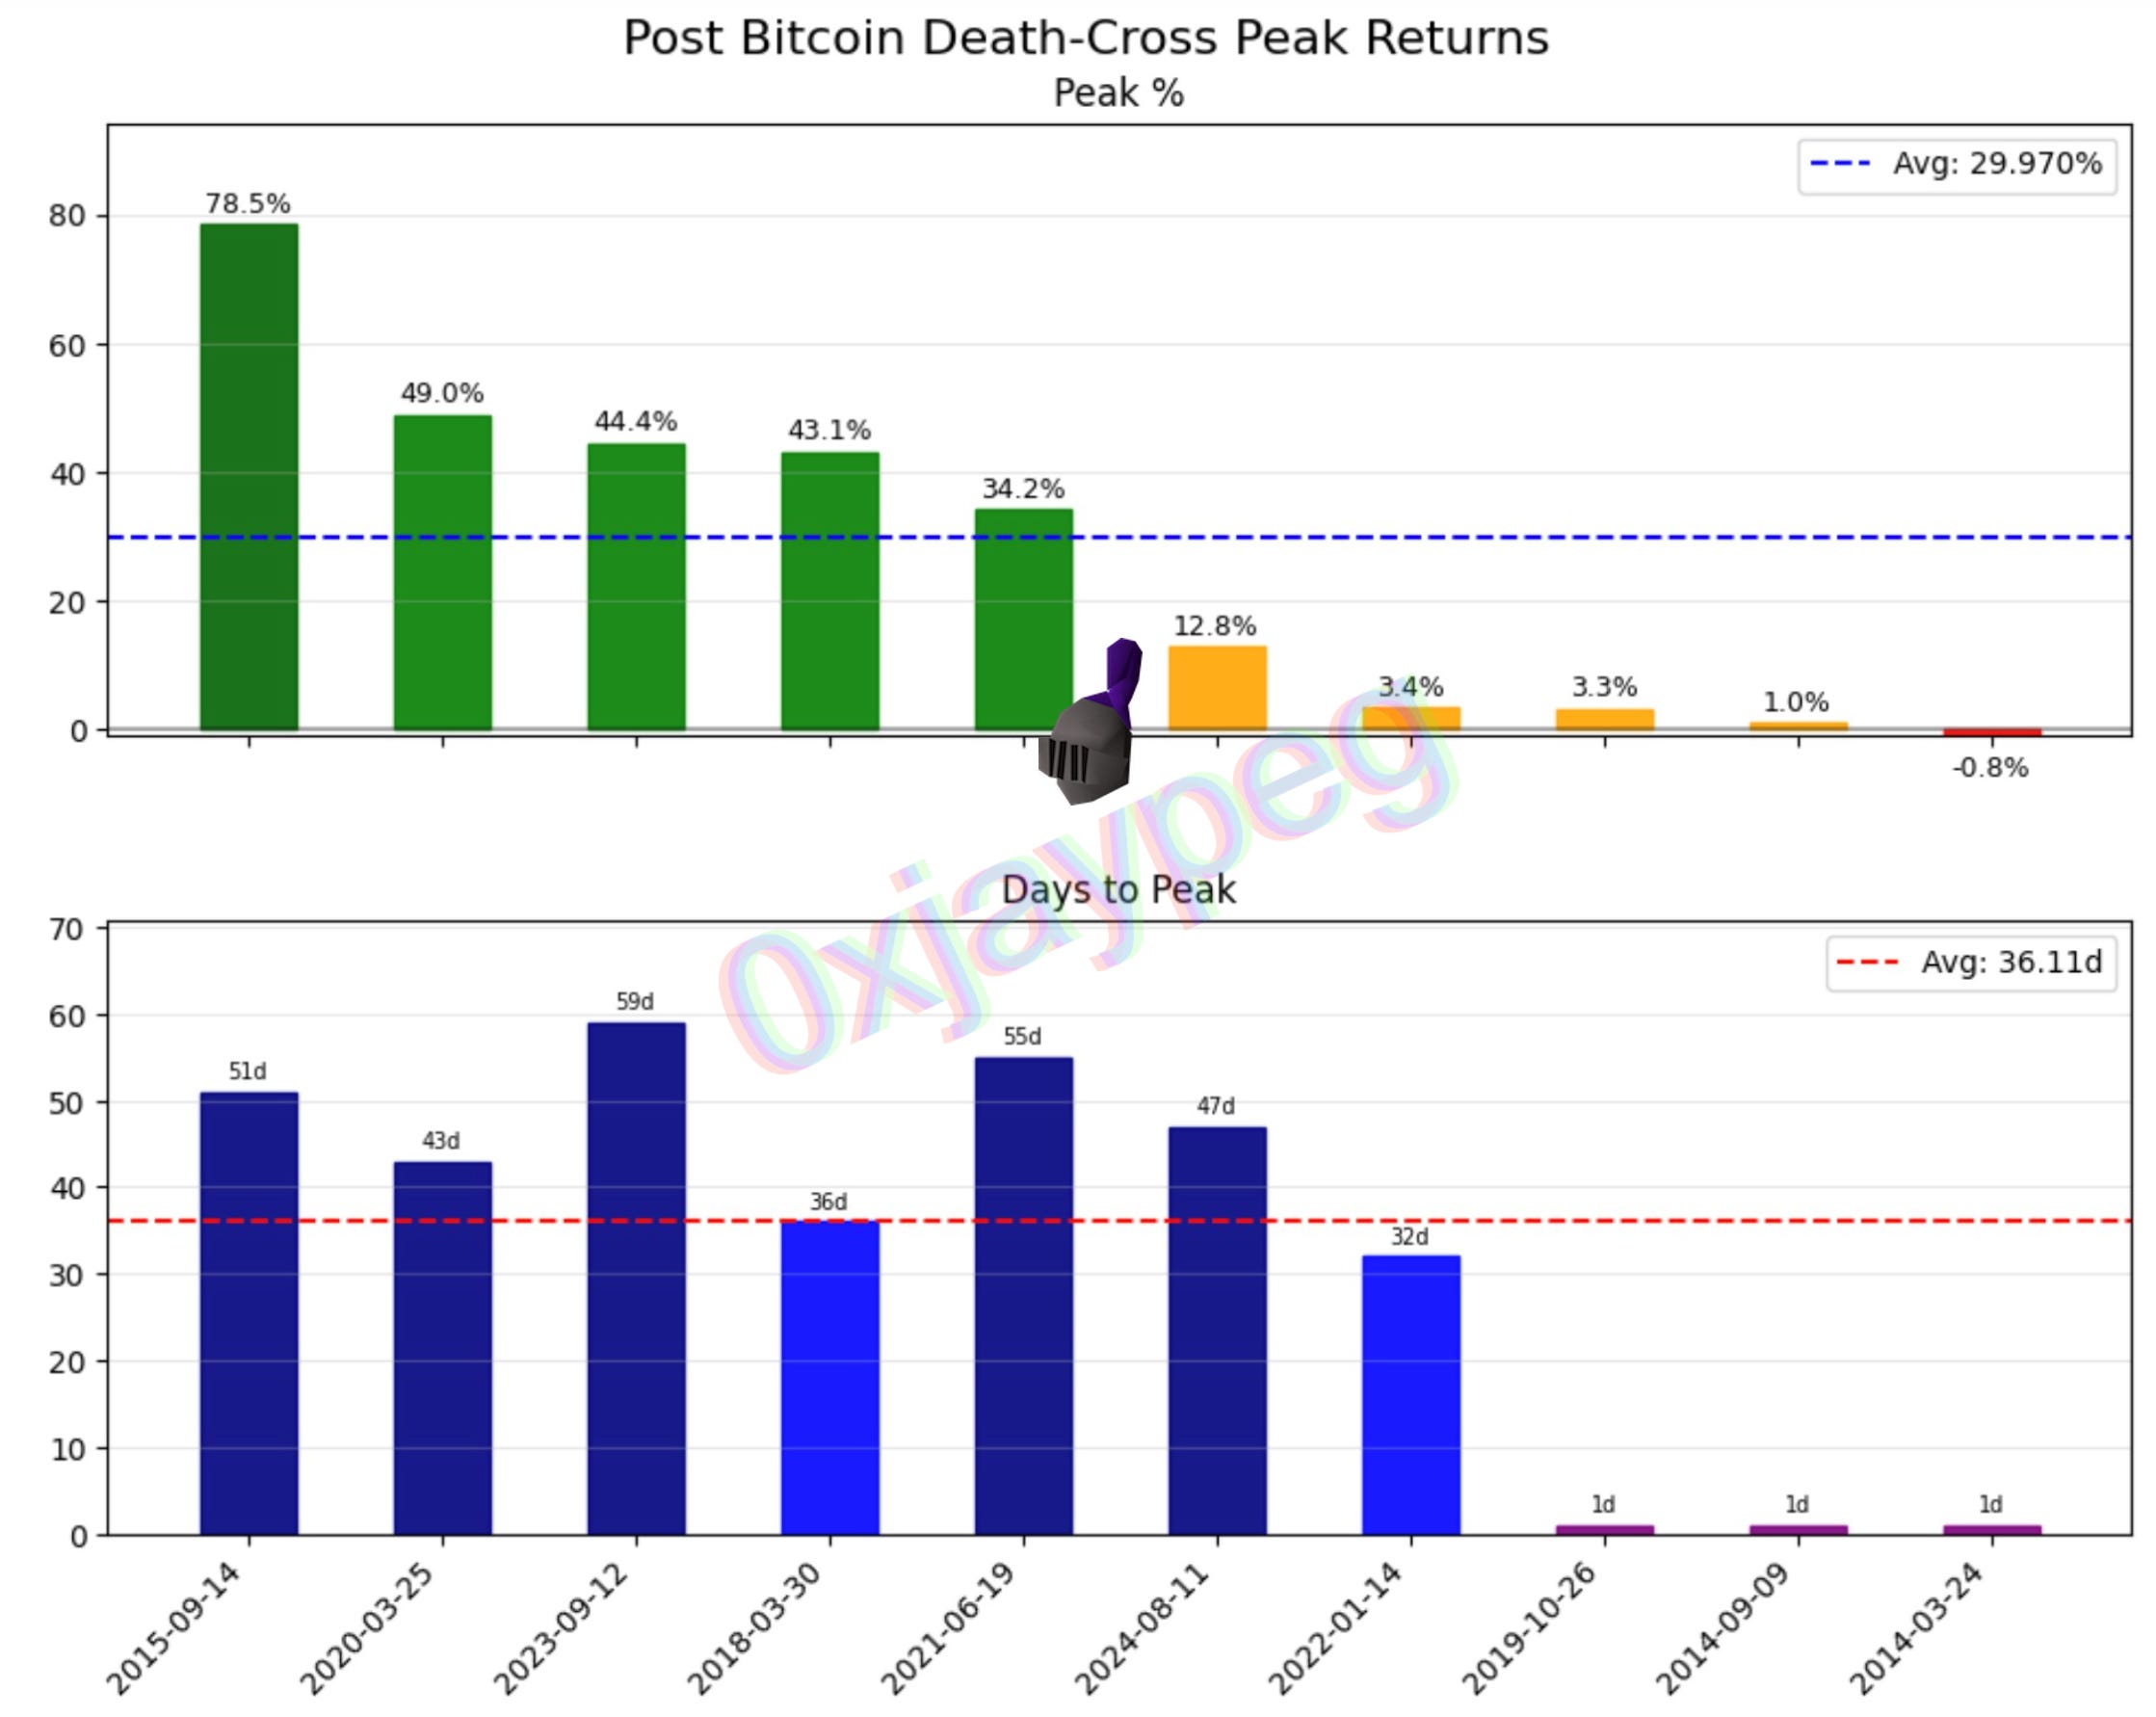
If we take a closer look at each of the instances:
only one of the resulted in a negative return relative to the closing price when the death cross formed
on average, the peak return ended up being +30% since the death cross, with over half of them being > 34%
Additionally, it took 36 days (on average) for the peak post death cross to play out
3 of the instances had the peaks be within the first day after the death cross — this likely means price went down in a ~straight~ line afterwards
The numbers actually lines up well with how bitcoin price action performs after a -25% decline (see chart below)
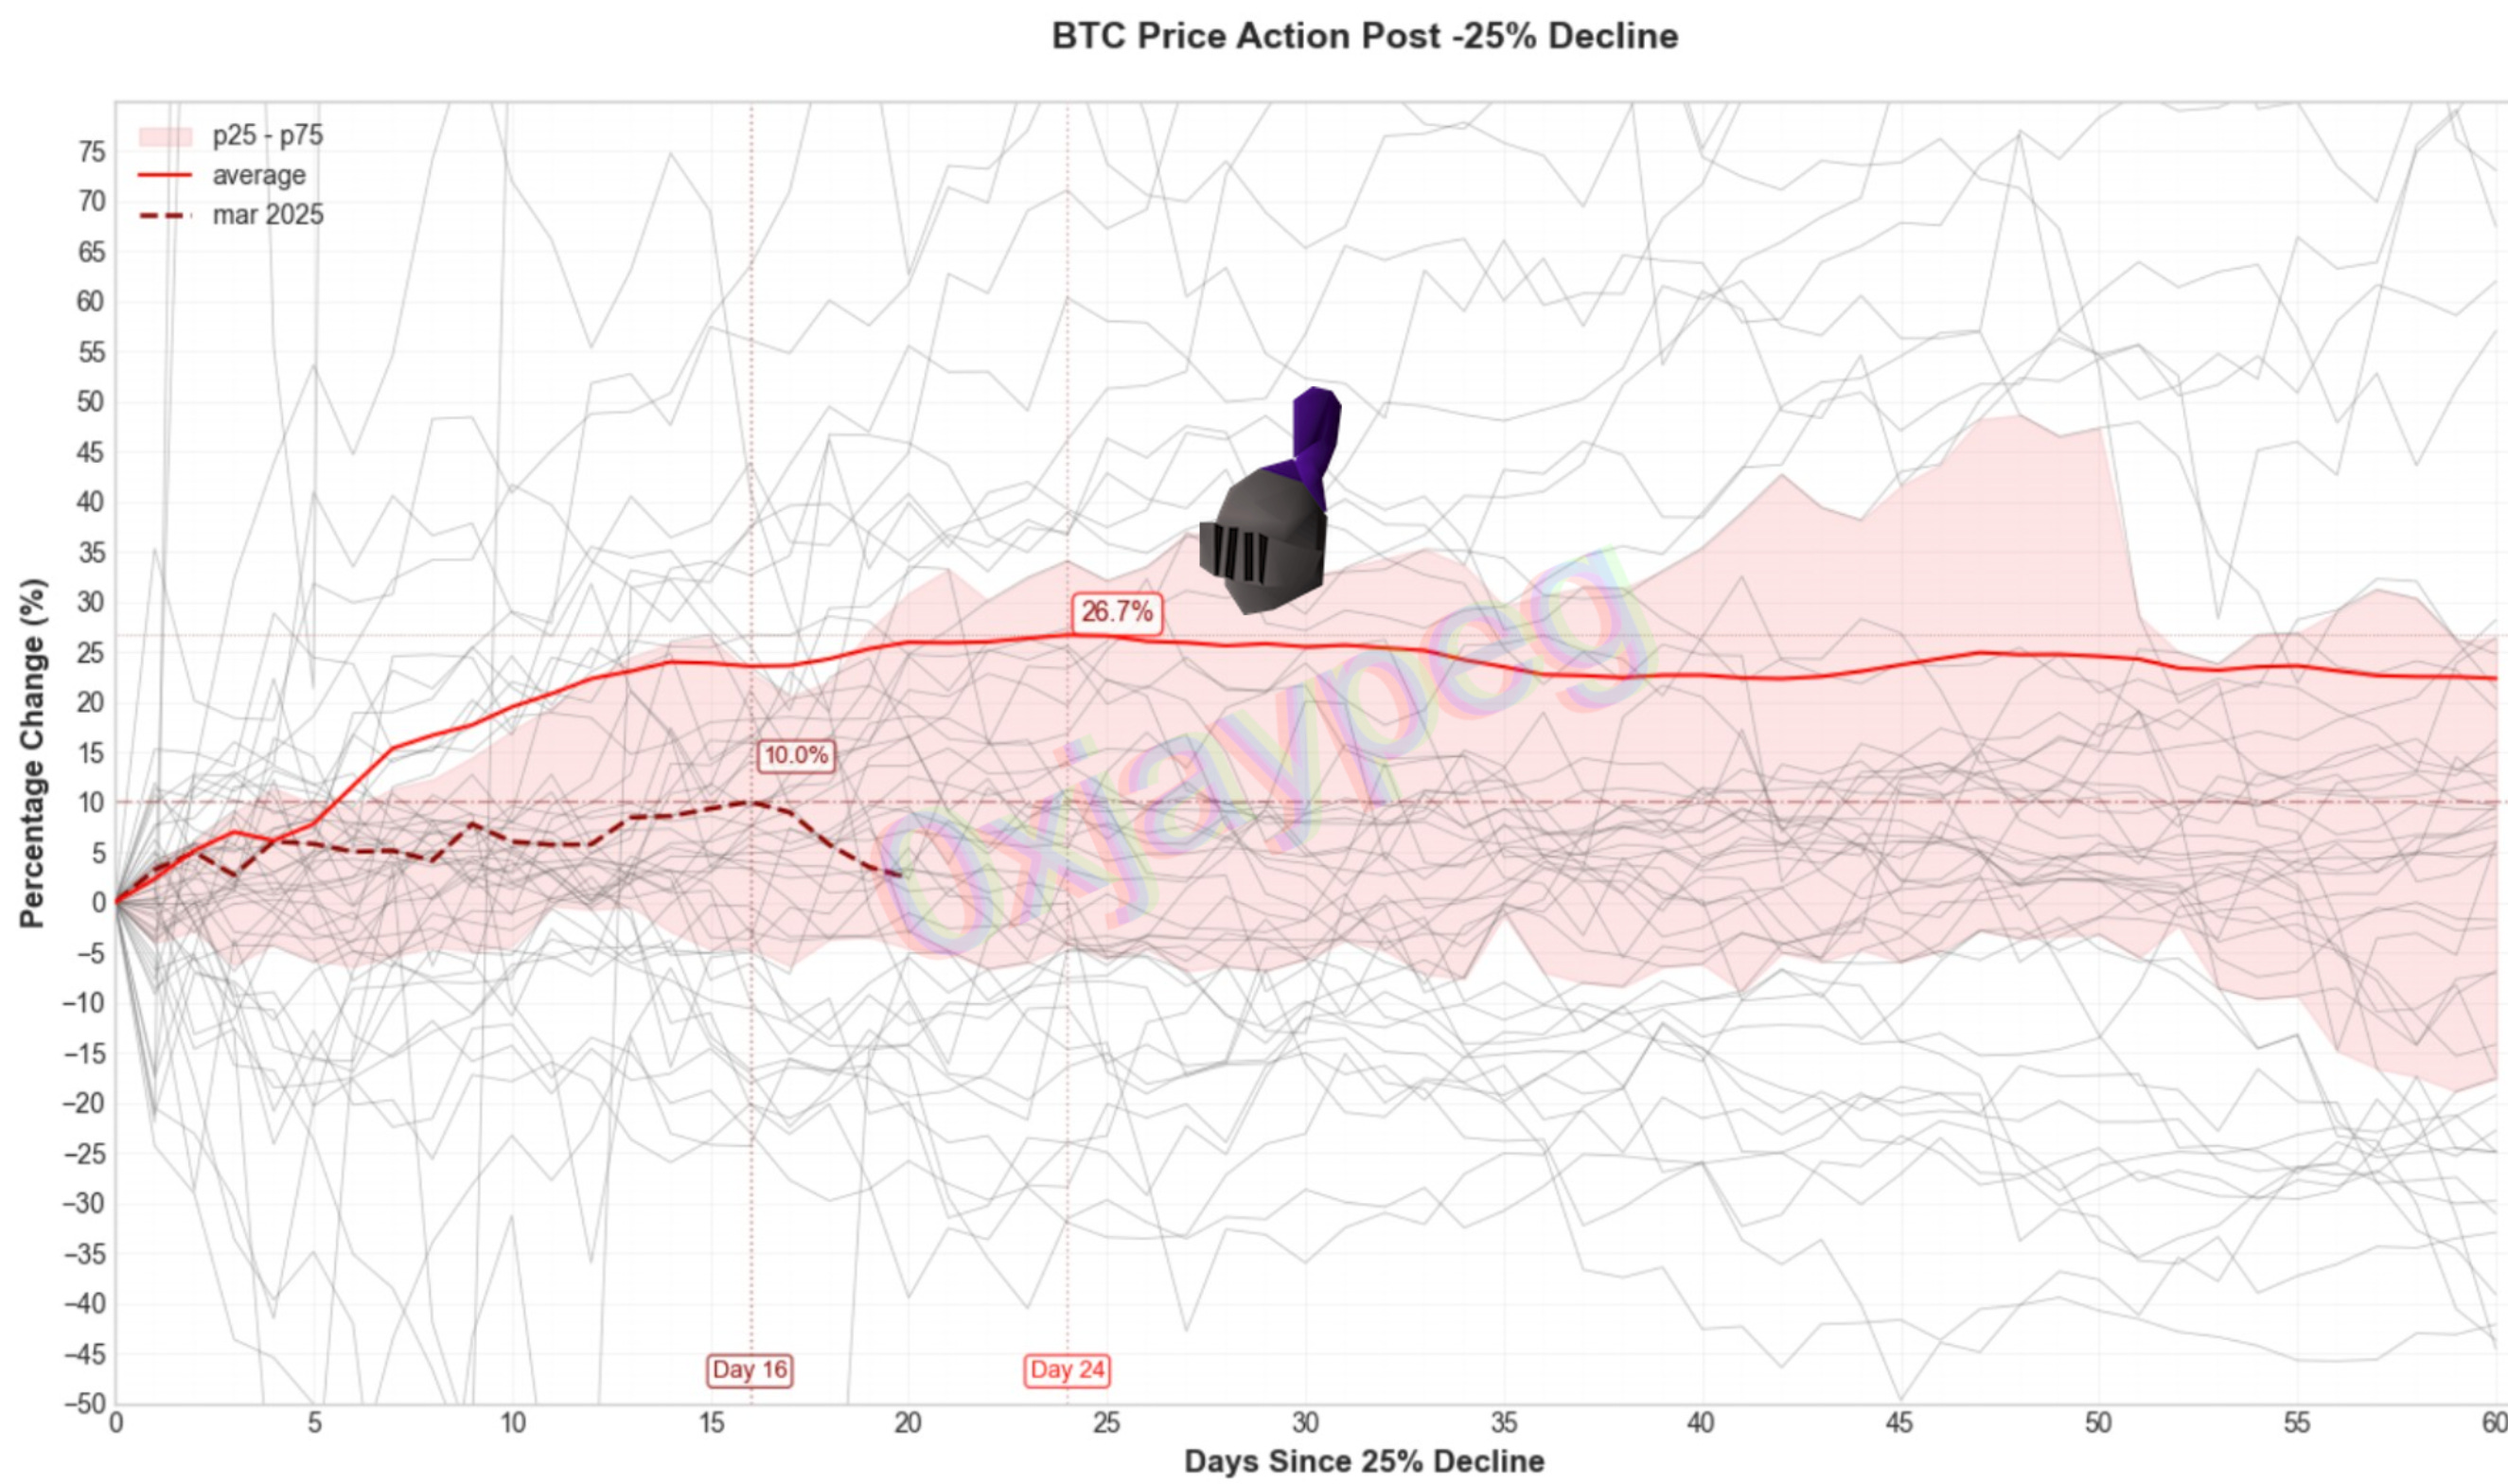
You can read more about the bitcoin price action post 25% decline here:
25% bitcoin price declines

We’ve most recently had a > 25% decline in bitcoin price from peak to trough. This inspired me to take a closer look at how prior 25% declines have resulted before.
—
NFA, DYOR