
25% bitcoin price declines


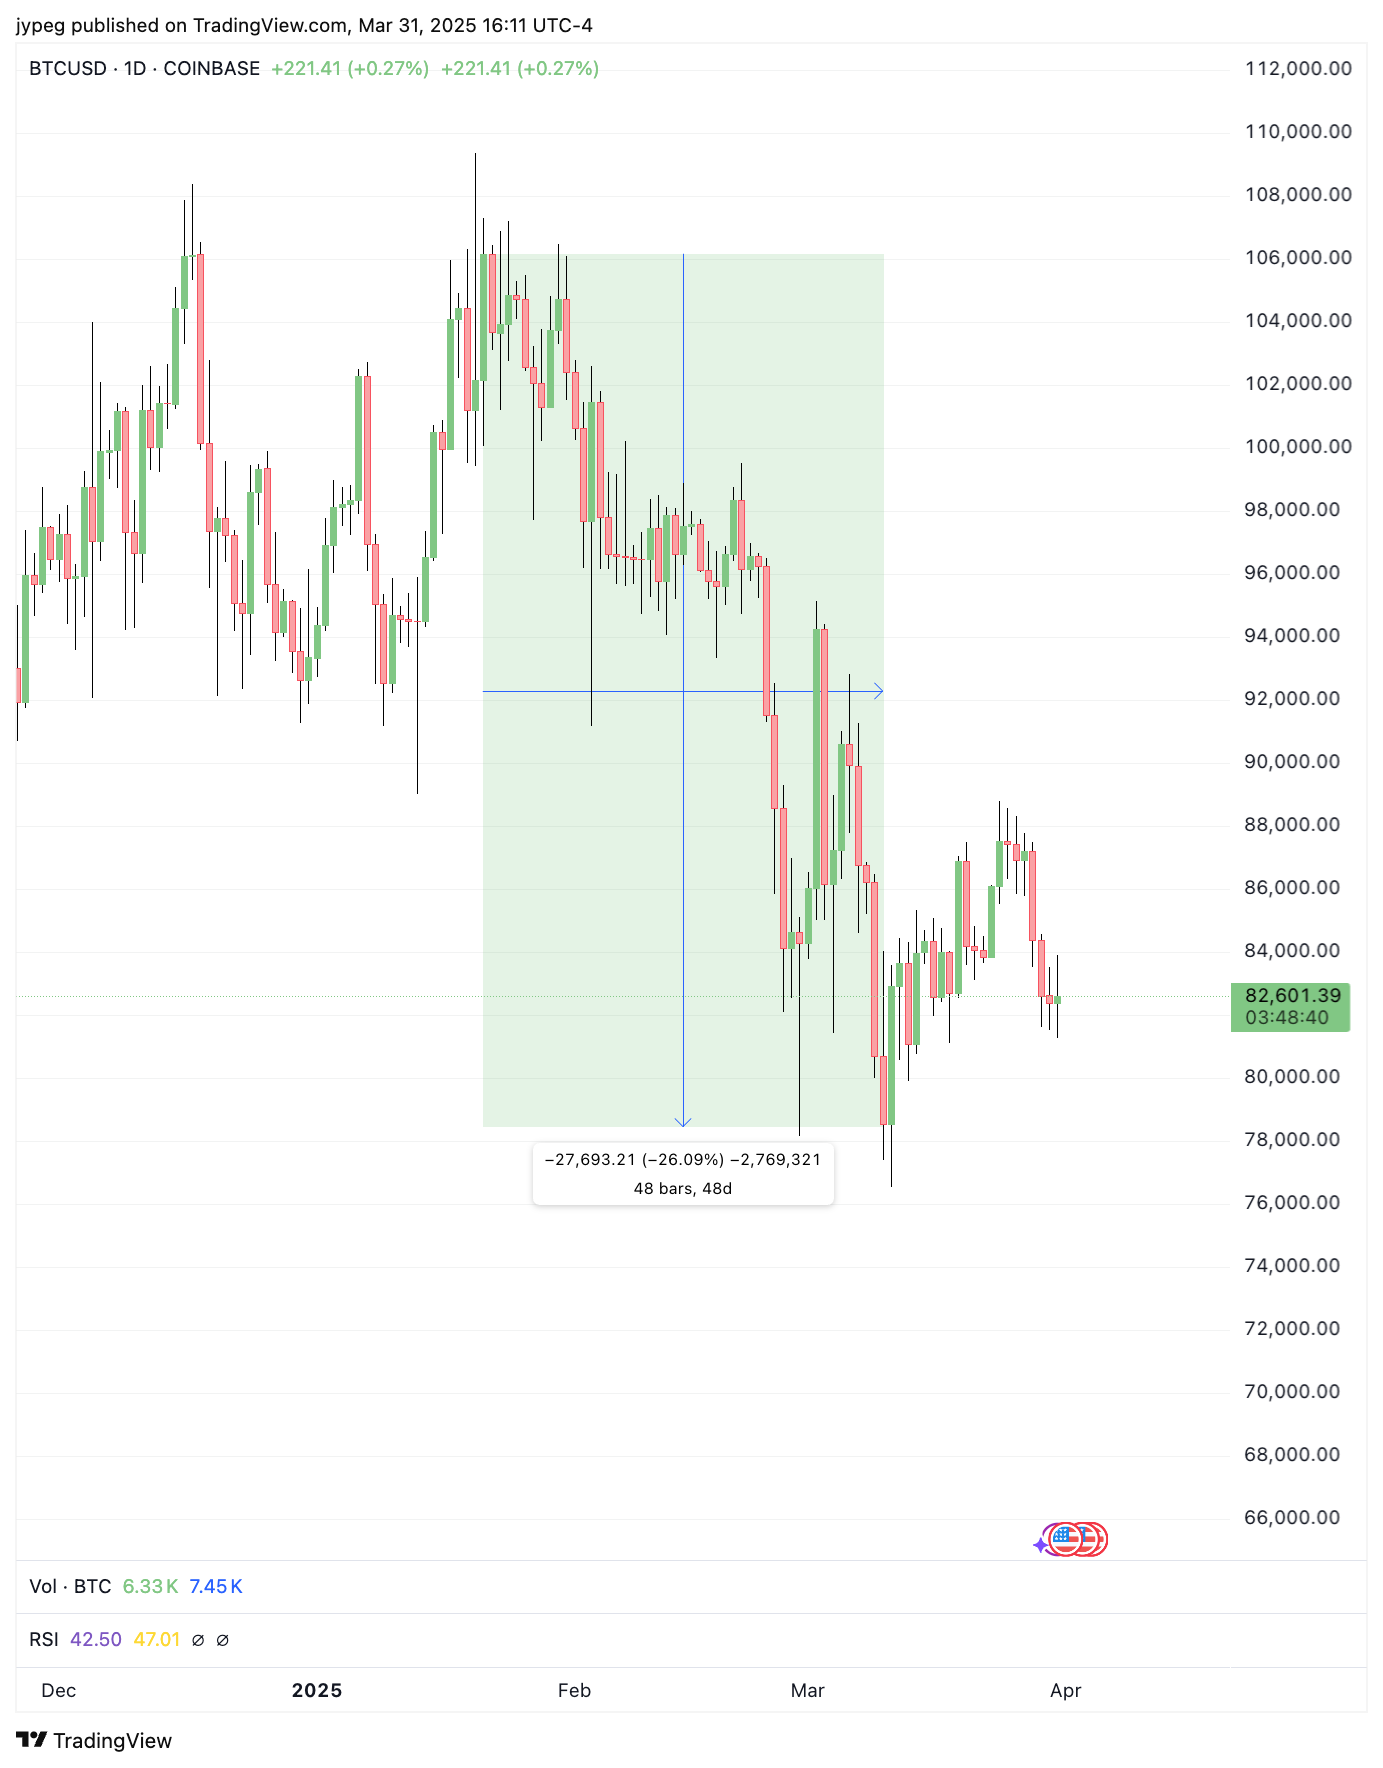
We’ve most recently had a > 25% decline in bitcoin price from peak to trough. This inspired me to take a closer look at how prior 25% declines have resulted before.
We’ve had 50 unique 25% (or greater) declines since 2013 on Bitcoin. On average, this happens about 4x a year, although it has only occurred once in 2024 and once in 2025.

On average, it takes about 25 days for a 25% (or greater) decline to play out. However historically, we’ve had these violent declines play out within 1 day.
Now, the real question is - after a 25% decline, how has price behaved afterwards? Does price tend to go up or down?

On average, price tends to rebound. Across all of our data points, price tends to bounce +26.7% over 24 days after a > 25% drop.
From our most recent > 25% drop, we peaked at +10% on Mar 26, 16 days after the bottom. We are now just hovering just above flat in terms of price.
Now let’s take a look at where bitcoin price peaks post 25% decline. In other words, this is the highest point that bitcoin bounces after a violent 25% (or higher) decline. We’ll vary the post decline window (60, 90, 120 days) and see how this affects the outcome.
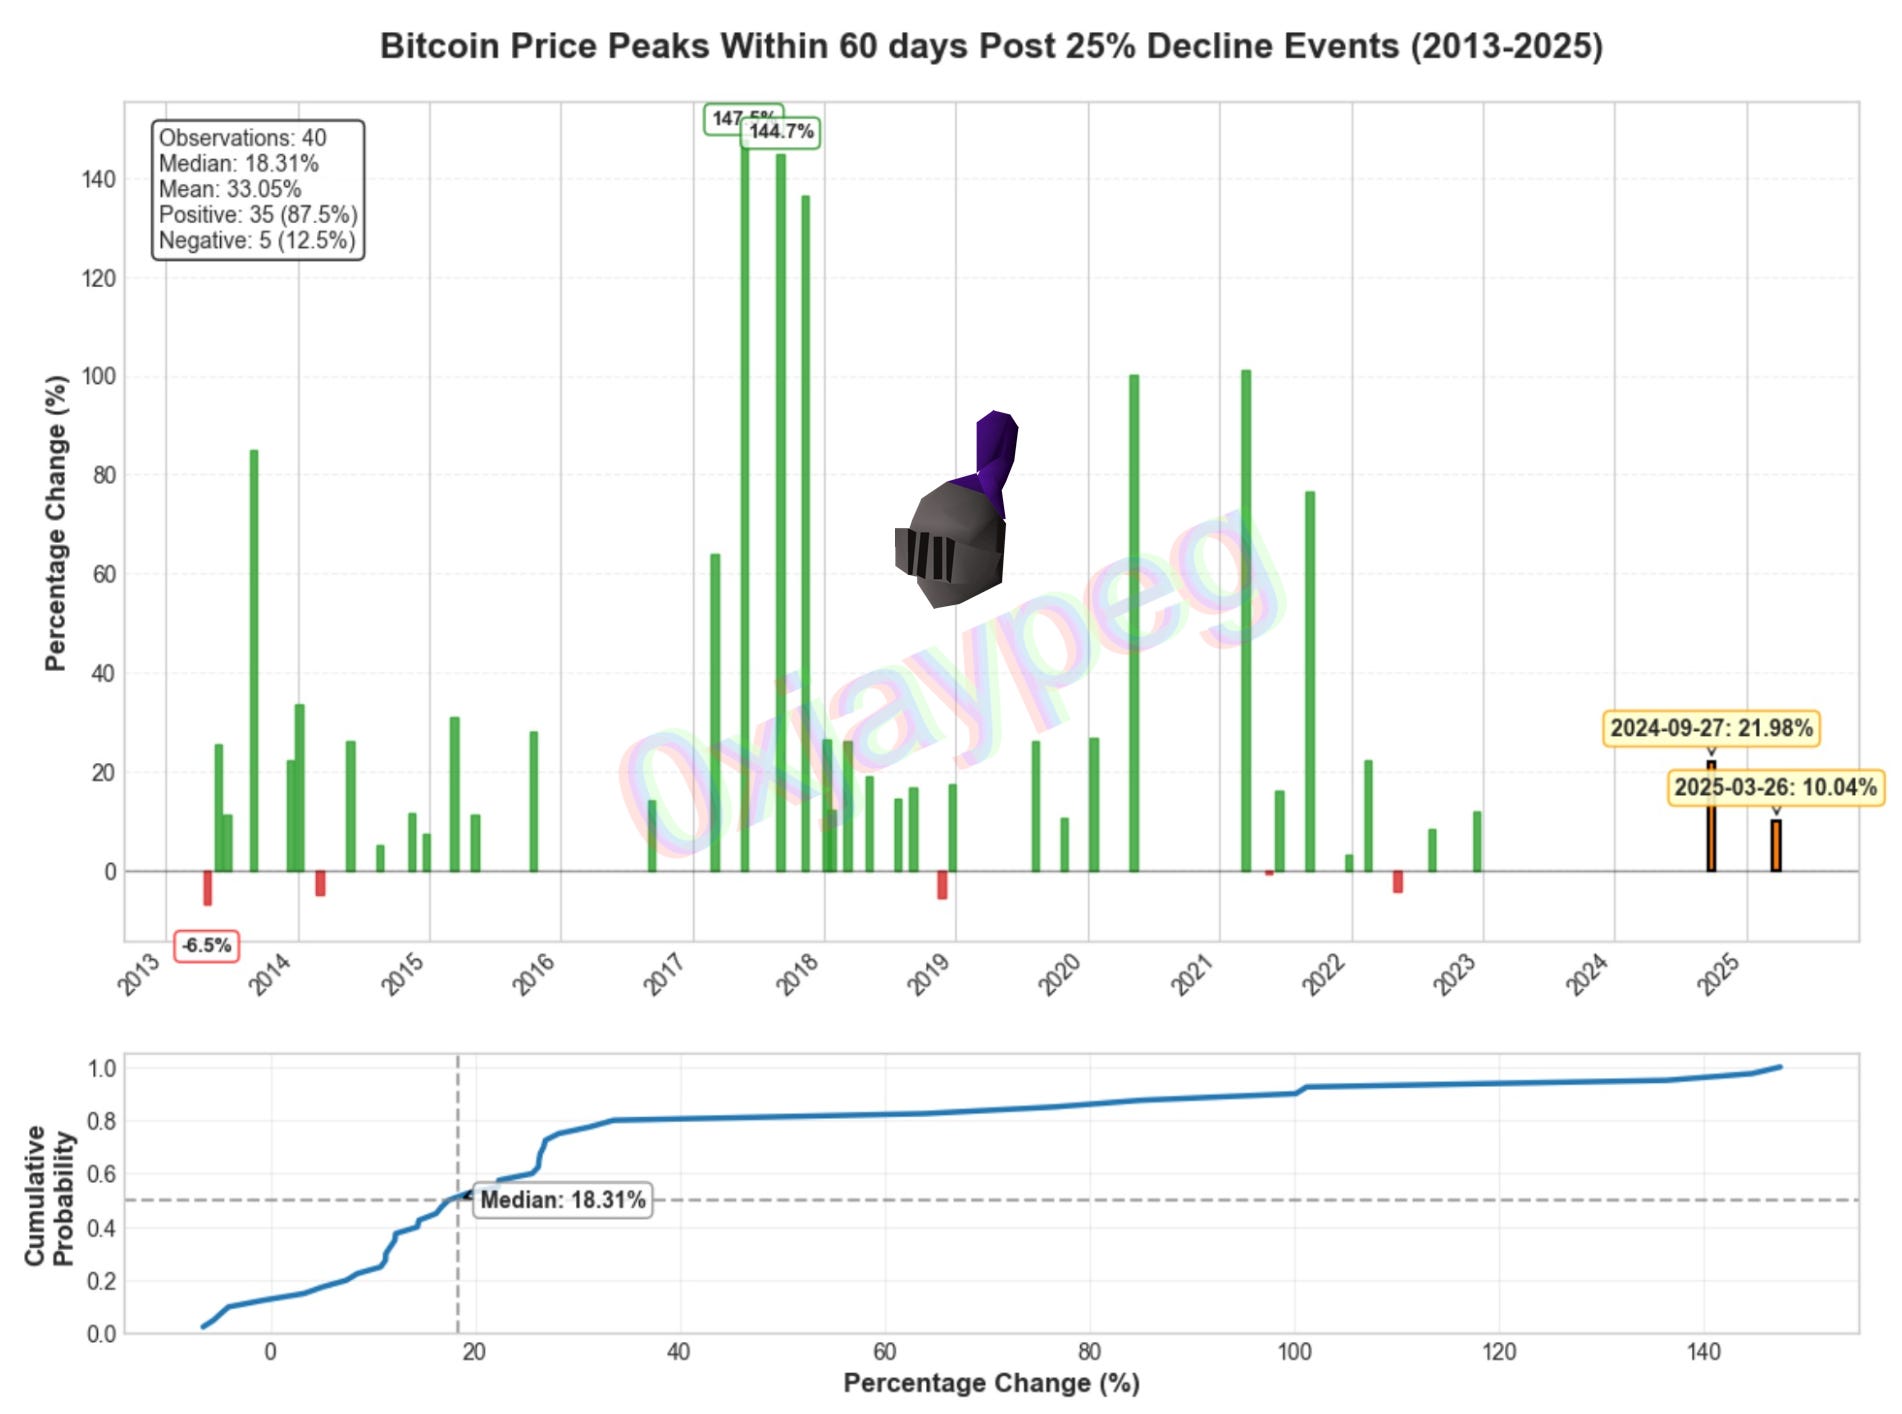
Within 60 days, the median is +18.31%. This means more than half of the data points (n=40 here) result in bounces that are greater or equal to +18.31%. Only 5 of the data points were negative.

Within 90 days, the median is +26.26%. This means more than half of the data points (n=39 here) result in bounces that are greater or equal to +26.26%. Only 4 (10.3%) of the data points were negative.
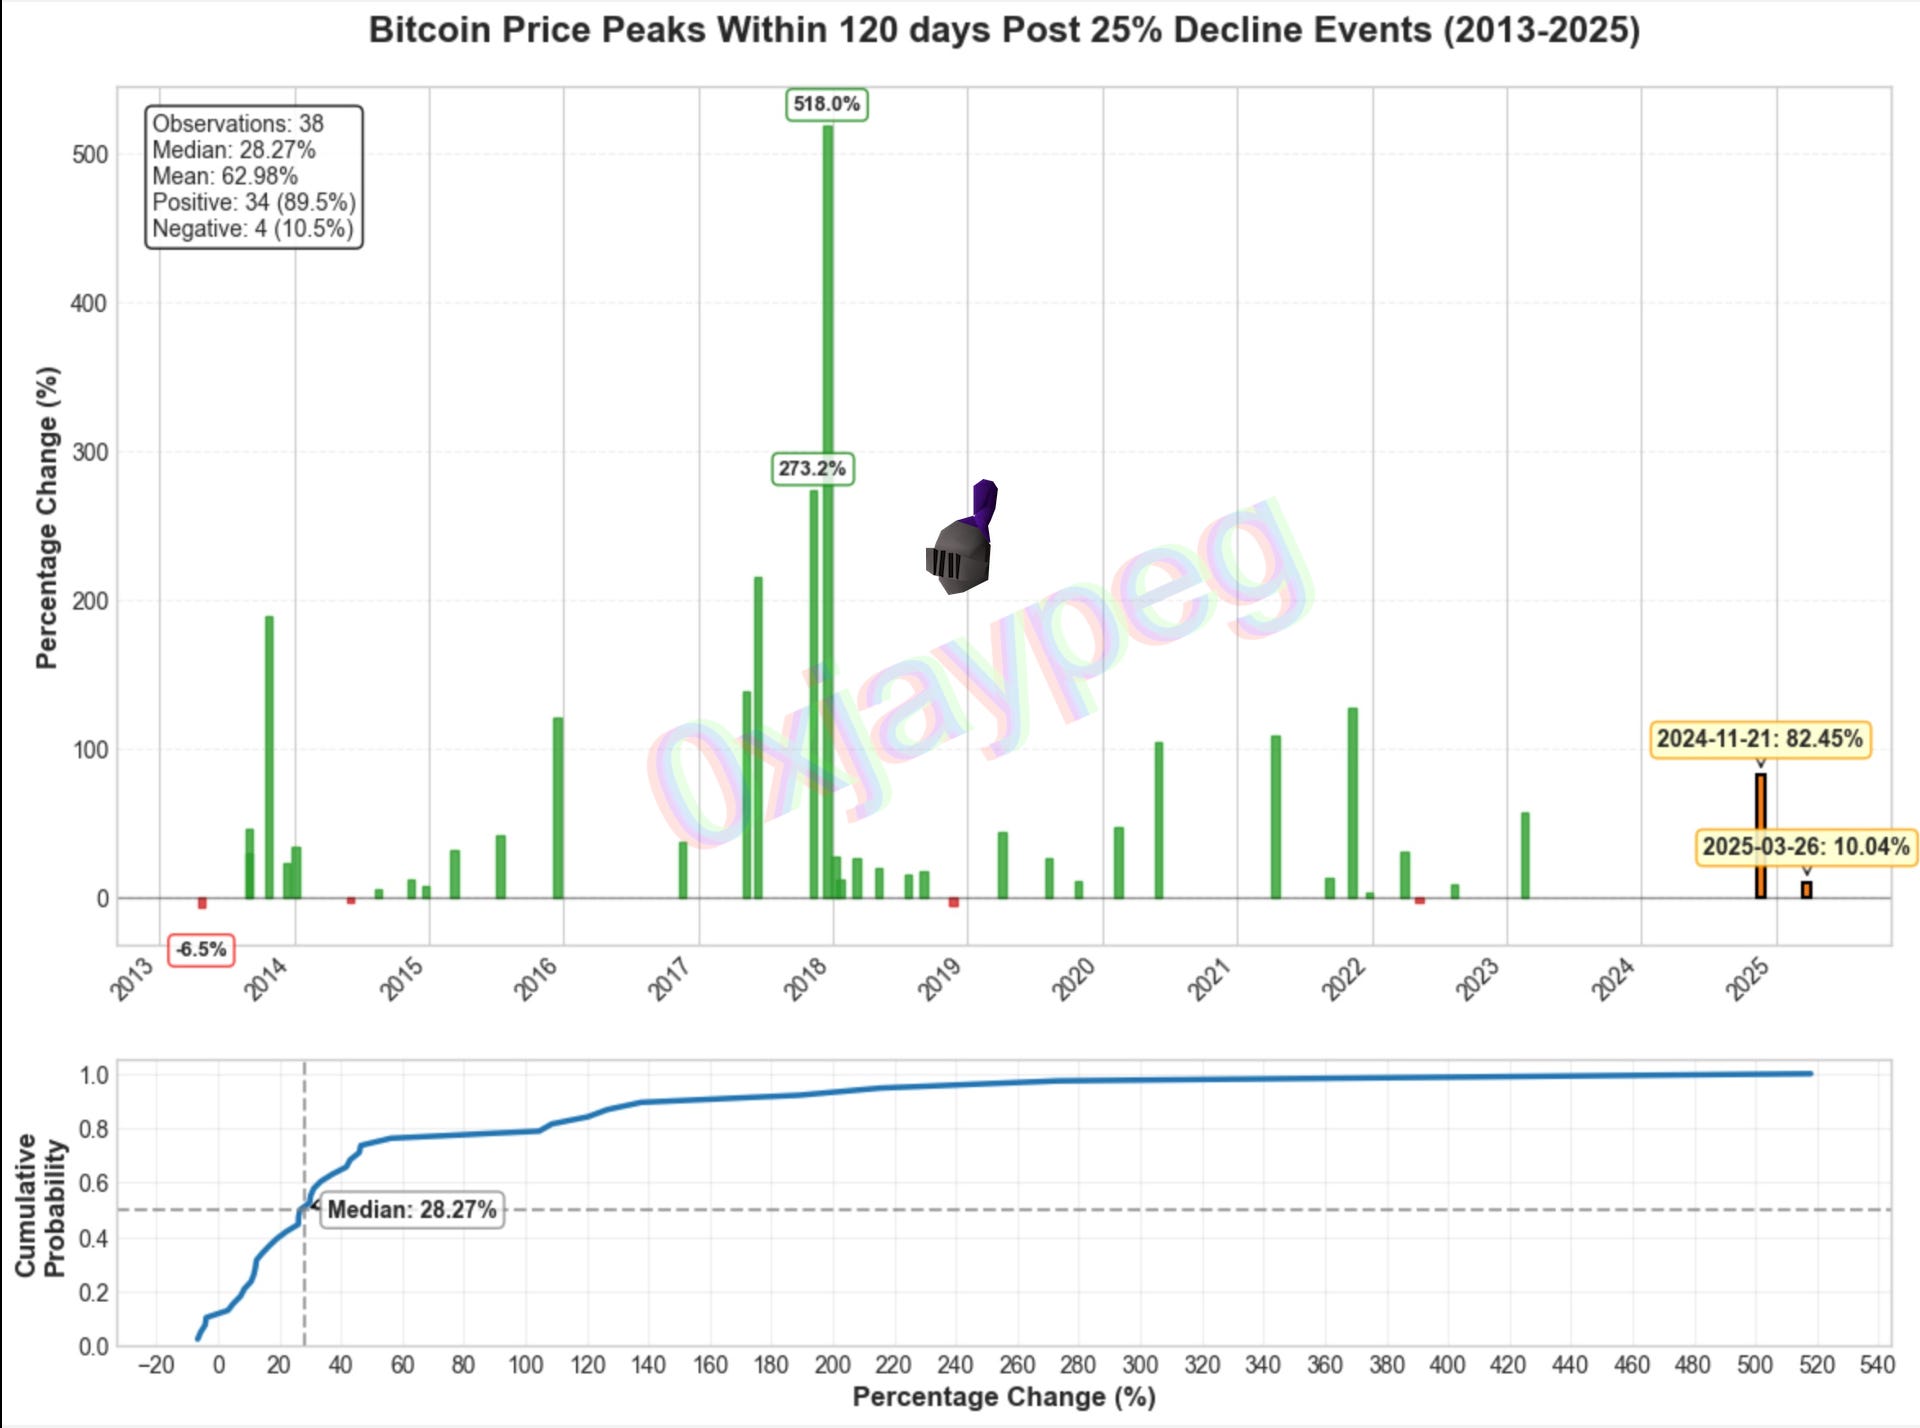
Within 120 days, the median is +28.27%. This means more than half of the data points (n=38 here) result in bounces that are greater or equal to 28.27%. Only 4 (10.5%) of the data points were negative.
Note: the sample size slightly diminishes as we extend the window since this creates overlaps. E.g. you can have a > 25% decline end on 1/01/20 and another end on 03/01/20, but if they both peak on 06/01/20, we only include one data point. As the window gets larger (e.g. 60 days → 120 days) there are more of these overlaps.
—
There are a million factors to consider, but if you remove everything outside of historical data, we are due for a larger bounce.
NFA DYOR